Showing posts with label BI. Show all posts

Monday, August 19, 2019

How to concatenate financial dimension values in a View for a given hierarchy

Following my previous posting How to filter existing transactions based on a financial dimension value set ,
I would like to show how we can construct a view with all financial dimension values for a given hierarchy, including placeholders for those values are absent.

In the aforementioned example, it was CDPDimensionAttributeValuesUnionConcatView view as depicted.


Instead of a series of dependant views, we can create one view as follows (CDPDimAttrSelectedView is just a set of selected attributes; explained in the previous link)


The key point is a computed column method, which creates a final string in the same sequence of attributes as selected in the hierarchy.


private static server str finDimValues()   // X++
    {
        return @"STUFF((SELECT '-' +
                        ISNULL(
                            STUFF((SELECT '-' + t3.DisplayValue
                                    from DimensionAttributeValueSetItemView as t3
                                    JOIN DimensionHierarchyLevel as t17
                                    on t17.DIMENSIONATTRIBUTE = t3.DIMENSIONATTRIBUTE
                                    join myFinDimAttrForAggr t25
                                        on
                                            t17.DIMENSIONHIERARCHY = t25.DIMENSIONHIERARCHY
                                    where
                                    t1.DimensionAttributeValueSet = t3.DimensionAttributeValueSet
                                    and t7.DIMENSIONATTRIBUTE = t3.DIMENSIONATTRIBUTE
                                    order by t17.LEVEL_
                                    FOR XML path('')
                                   ), 1, 1, '')
                            , 'N/A')
     
                    FROM DIMENSIONATTRIBUTE t6
                        JOIN DimensionHierarchyLevel as t7
                                on t7.DIMENSIONATTRIBUTE = t6.RECID
                                join myFinDimAttrForAggr t15
                                    on
                                        t7.DIMENSIONHIERARCHY = t15.DIMENSIONHIERARCHY
                    FOR XML PATH('')), 1, 1, '')";

    }


Thanks a lot for all participants on the forum thread, and especially to Kair84 who helped me with SQL command.

Wednesday, August 14, 2019

How to get running totals in view

Let's say we need to see bank account balances per day with running totals.

A running totals query is a query in which the total for each record is a summation of that record and any previous records. This type of query is useful for displaying cumulative totals over a group of records (or over a period of time) in a graph or report.

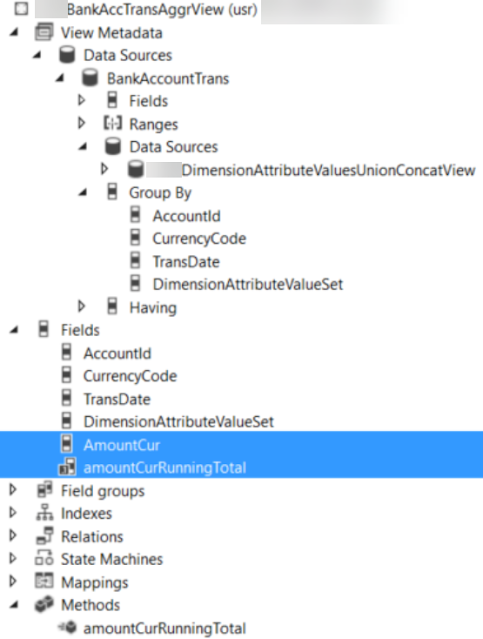
The simplest way to achieve it is to create a view for BankAccountTrans table and add any groupings you need.


In my example, these are Bank account, transaction currency, financial dimension set, and, of course, transaction date.


I use standard aggregation Sum for my daily total and a computed column for running total.


The computed column method reads as follows


public class myBankAccTransAggrView extends common
{
    private static server str amountCurRunningTotal()   // X++
    {
        return "sum(sum(t1.AMOUNTCUR)) OVER (PARTITION by t1.DATAAREAID, t1.ACCOUNTID, t1.CURRENCYCODE  order by t1.TransDate)";
    }

}

It is ready for consumption; enjoy your BI inside of D365!


Friday, August 9, 2019

How to filter existing transactions based on a financial dimension value set

Let's assume that we want to see our bank accounts balances grouped by a financial set, which may be different than that set up for your transactions.


For example, existing transactions presume to have values for the following dimension attributes.


However, our selection can be different. For this exercise sake I opted for Business unit and Department.


So, instead of one balance for the whole bank account, we want to get it distributed per every combination of Business unit and Department values.


Another point to consider is the fact that these attributes are not mandatory; in other words, we don't have values for all attributes in all transactions.


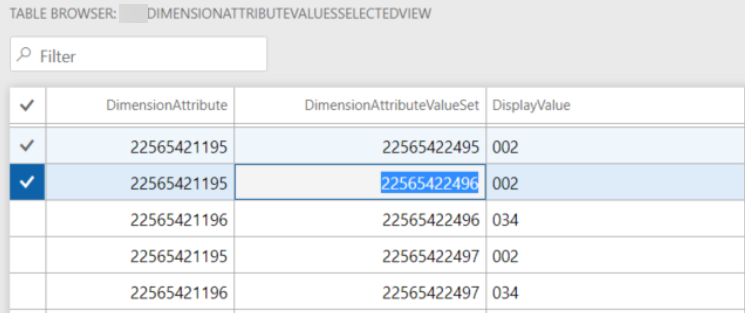
It can be easily achieved if we find a way to create a column with all sought dimension attribute values concatenated as depicted.


Generally speaking this is a job a BI solution; however, it is possible to do in D365 by means of Views.

Let's solve this problem step by step.

Fisrt view is for all selected attributes that we should populate values for, exist them or not.


Second, collect all existing values which match our selected attributes.


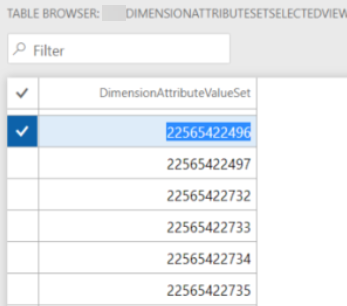
Then, group all found dimension attribute sets.


Now we create a view based on the latter and sought attributes without relation in outer join. By that we will get a Cartesian product of all possible combinations between them.


At this step we outer join the latter with the found (existing) values. Here we can add a computed column if we want to see something else than just an empty value.


private static server str displayValueWithNA()   // X++
{
    str         sRet;
    tableName   viewName                = viewstr(myDimensionAttributeValuesUnionView);
    str         cDisplayValue  = SysComputedColumn::comparisonField(viewName,
                                                                                viewstr(myDimensionAttributeValuesSelectedView),
                                                                                fieldStr(myDimensionAttributeValuesSelectedView, DisplayValue));
    
    sRet =
        SysComputedColumn::if(SysComputedColumn::isNotNullExpression(cDisplayValue),
                                cDisplayValue,
                                SysComputedColumn::returnLiteral('n/a')
                            );
 
    return sRet;
}


Final view will contain all the values found on the previous step grouped by dimension attribute value set so that in a computed column all values be concatenated in the required order.


private static server str finDimValues()   // X++
{
    return @"STUFF((SELECT '-' + t3.DisplayValue
                from myDimensionAttributeValuesUnionView as t3
                where
                t1.DimensionAttributeValueSet = t3.DimensionAttributeValueSet
                order by t3.DIMENSIONATTRIBUTE
                for xml path('')), 1, 1, '')";
}


Having this view in inner join combination allows you to filter any transactional data by a set of dimensions without coding.


Friday, January 5, 2018

AX 2012 Wizard does not update Analysis Serivce Project: workaround

Recently I bumped into a strange issue in AX 2012, which prevents importing Analysis Services Projects to AOT.

Given that this import is an essential part of cubes development and deployment, I decided to find a way to get this thing done.

The issue is in the fact that nevertheless all changes made to your perspective are successfully present in the Wizard tree, they are never saved back to AOT. Therefore, the previous version of your project is always deployed to SQL, no matter what you try to achieve.

The workaround is pretty simple. Make up your perspective, run the Wizard and let it finish its job. Make Deploy option unchecked because it is pointless.


Once the Wizard window is closed, just find your project in the node of Analysis Services Projects and delete it.


Then find a recently created folder in your TEMP directory; this one must contain your recently added artifacts, say, financial dimensions as depicted.


Here we go.


Now just import this particular project back to AOT, and run the Wizard again to deploy the projects.


It is also worth double-checking the project content in Visual Studio before running the Wizard for the second time.


If you missed the target, find the right folder with your added/changed objects.

Now the Wizard should find no changes and just deploy it.


Sunday, September 26, 2010

Pictures from the seminar

Some pictures from BI seminar are here.


PowerPivot in Excel 2010 looks really cool!

Thursday, September 16, 2010

Business Intelligence Seminar in Montreal, September 25

BI: SSIS, SSRS, SSAS, PowerPivot, OLAP Cubes. The event will be in Montreal, more info.


Who's going to participate?