Saturday, November 30, 2019
Wednesday, November 27, 2019
Enum extensions case in D365
Added two new values to an enum in the same model but in two different extensions.
The first one is looped perfectly (see code snippet below), and nothing but an index for the second. However, its value is present in a combobox.
Already built and synchronized the whole world. What else can it be?
Take a look from the SQL side.
There are some old values that I created before but deleted later. All of them are still there.
I had to delete these non-synced values manually from SQL, then added needed values in AOT, and synched DB.
In fact, DB sync is triggered if you have some changes in tables/views only.
Now it is correctly recreated.
BTW there are two good articles about the subject
1) Extensible enums: Breaking change for .NET libraries that you need to be aware of
2) Development tutorial: Extensible base enumerations in Microsoft Dynamics AX 7
The first one is looped perfectly (see code snippet below), and nothing but an index for the second. However, its value is present in a combobox.
[ExtensionOf(formStr(SysPolicyParameters))]
final public class mySysPolicyParametersForm_Extension
{
    public void populateTree()
    {
        DictEnum          policyRuleTypeEnum;
        int               i;
        policyRuleTypeEnum = new DictEnum(enumNum(SysPolicyRuleTypeEnum));


        for(i = 0; i < policyRuleTypeEnum.values(); i++)
        {
            str sym = policyRuleTypeEnum.value2Symbol(i);
            info(strFmt("%1 %2 %3", i, policyRuleTypeEnum.value2Name(i), sym));
        }


        next populateTree();
    }
}
Take a look from the SQL side.
There are some old values that I created before but deleted later. All of them are still there.
I had to delete these non-synced values manually from SQL, then added needed values in AOT, and synched DB.
In fact, DB sync is triggered if you have some changes in tables/views only.
Now it is correctly recreated.
BTW there are two good articles about the subject
1) Extensible enums: Breaking change for .NET libraries that you need to be aware of
2) Development tutorial: Extensible base enumerations in Microsoft Dynamics AX 7
Wednesday, November 20, 2019
Operating with system defined buttons in form Action pane
Say, we have to reference Edit button.
For this we use the macro #define.SystemDefinedViewEditButton('SystemDefinedViewEditButton')
The whole list is present in SysSystemDefinedButtons macro
Code snippet for your active method in name_DS
Check this article https://docs.microsoft.com/en-us/dynamics365/fin-ops-core/dev-itpro/user-interface/system-defined-buttons
For this we use the macro #define.SystemDefinedViewEditButton('SystemDefinedViewEditButton')
The whole list is present in SysSystemDefinedButtons macro
Code snippet for your active method in name_DS
int active()
        {

            #SysSystemDefinedButtons

            ret = super();

         < ... >
            FormCommandButtonControl editButton = element.control(element.controlId(#SystemDefinedViewEditButton)) as FormCommandButtonControl;
            editButton.enabled(name_ds.allowEdit());

            return ret;
        }
Check this article https://docs.microsoft.com/en-us/dynamics365/fin-ops-core/dev-itpro/user-interface/system-defined-buttons
Labels:
actionpane,
button,
D365,
edit,
form,
FormDataSource,
macro
Friday, November 15, 2019
Thursday, November 14, 2019
Saturday, October 5, 2019
Electronic Reporting Webinar Screenshots, Part 1: Building and Debugging Configurations
First of all, I 'd like to thank the Microsoft Localization Team provided this free webinar about Electronic Reporting and Electronic Messages (in Russian).
I simply tried to output the gist of it by taking some snapshots from this very long demonstration.
In the first part, Nikolay Selin explains how the Electronic Reporting (ER) can be set up by showing practical examples of building and testing configurations.
In brief, ER can be used both for incoming and outgoing data flows.
So I tend to consider this functionality not as reporting only but as well as a data exporting/importing tool. Please read the full documentation on Microsoft site.
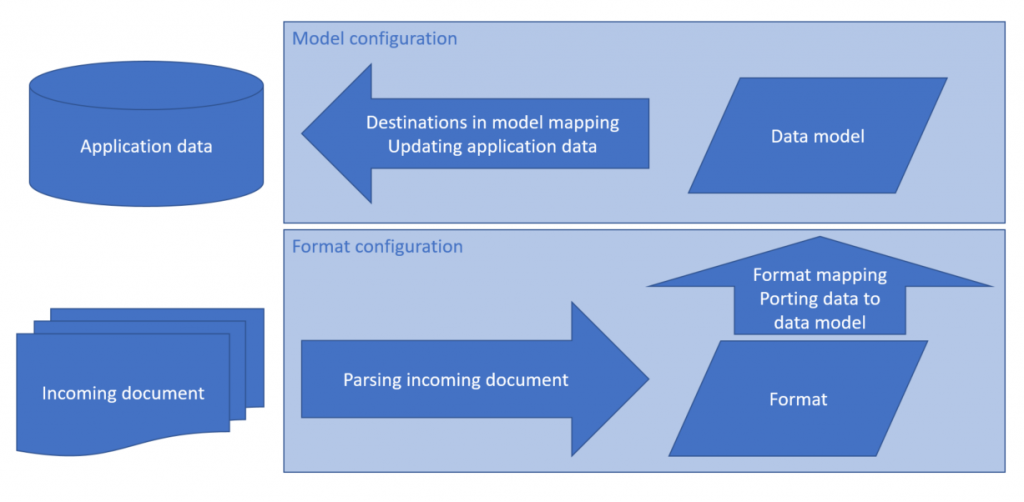
The main point from the developer's perspective is decoupling data from their presentation.
We build a data model, which is mapped to the actual data in D365 (tables, classes etc) on one side, and to the specific presentation format on the other.
Well, I hope all images are self-explaining.
Building a configuration for Export.
Create a data model
Create a format
Map the data model to data sources
Preview the data to be used in the format
Activate versions
You can use an Excel template for the target format.
Create a template.
Load it to the format
Map it to the data model
 How final results will look like
Building a configuration for Import
Create with the direction to Destination.

Create a format to read from a comma-separated file (CSV). It can be no lines in a file.
Map the format to the data model
and map it to data sources
Debugging configurations
Analyze its execution tracing log
as well as execution steps details
Data sourcing and delivering.
We can use as a source for incoming data or a target for output reports multiple options, something similar to what we have in Report destination for standard reporting, but it includes Sharepoint folders for importing data as well.
Thanks for looking my pictures. Now it is time to practice it at your own!
I simply tried to output the gist of it by taking some snapshots from this very long demonstration.
In the first part, Nikolay Selin explains how the Electronic Reporting (ER) can be set up by showing practical examples of building and testing configurations.
In brief, ER can be used both for incoming and outgoing data flows.
So I tend to consider this functionality not as reporting only but as well as a data exporting/importing tool. Please read the full documentation on Microsoft site.
The main point from the developer's perspective is decoupling data from their presentation.
We build a data model, which is mapped to the actual data in D365 (tables, classes etc) on one side, and to the specific presentation format on the other.
Well, I hope all images are self-explaining.
Building a configuration for Export.
Create a data model
Create a format
Map the data model to the format
Map the data model to data sources
Preview the data to be used in the format
Activate versions
You can use an Excel template for the target format.
Create a template.
Load it to the format
Map it to the data model
 How final results will look like
Building a configuration for Import
Create with the direction to Destination.

Create a format to read from a comma-separated file (CSV). It can be no lines in a file.
Map the format to the data model
Set up the target entity parameters for the data model
and map it to data sources
Debugging configurations
Analyze its execution tracing log
as well as execution steps details
Data sourcing and delivering.
We can use as a source for incoming data or a target for output reports multiple options, something similar to what we have in Report destination for standard reporting, but it includes Sharepoint folders for importing data as well.
Thanks for looking my pictures. Now it is time to practice it at your own!
моментальные снимки
Monday, August 19, 2019
How to concatenate financial dimension values in a View for a given hierarchy
Following my previous posting How to filter existing transactions based on a financial dimension value set ,
I would like to show how we can construct a view with all financial dimension values for a given hierarchy, including placeholders for those values are absent.
In the aforementioned example, it was CDPDimensionAttributeValuesUnionConcatView view as depicted.
Instead of a series of dependant views, we can create one view as follows (CDPDimAttrSelectedView is just a set of selected attributes; explained in the previous link)
The key point is a computed column method, which creates a final string in the same sequence of attributes as selected in the hierarchy.
Thanks a lot for all participants on the forum thread, and especially to Kair84 who helped me with SQL command.
I would like to show how we can construct a view with all financial dimension values for a given hierarchy, including placeholders for those values are absent.
In the aforementioned example, it was CDPDimensionAttributeValuesUnionConcatView view as depicted.
Instead of a series of dependant views, we can create one view as follows (CDPDimAttrSelectedView is just a set of selected attributes; explained in the previous link)
The key point is a computed column method, which creates a final string in the same sequence of attributes as selected in the hierarchy.
private static server str finDimValues()   // X++
    {
        return @"STUFF((SELECT '-' +
                        ISNULL(
                            STUFF((SELECT '-' + t3.DisplayValue
                                    from DimensionAttributeValueSetItemView as t3
                                    JOIN DimensionHierarchyLevel as t17
                                    on t17.DIMENSIONATTRIBUTE = t3.DIMENSIONATTRIBUTE
                                    join myFinDimAttrForAggr t25
                                        on
                                            t17.DIMENSIONHIERARCHY = t25.DIMENSIONHIERARCHY
                                    where
                                    t1.DimensionAttributeValueSet = t3.DimensionAttributeValueSet
                                    and t7.DIMENSIONATTRIBUTE = t3.DIMENSIONATTRIBUTE
                                    order by t17.LEVEL_
                                    FOR XML path('')
                                   ), 1, 1, '')
                            , 'N/A')

                    FROM DIMENSIONATTRIBUTE t6
                        JOIN DimensionHierarchyLevel as t7
                                on t7.DIMENSIONATTRIBUTE = t6.RECID
                                join myFinDimAttrForAggr t15
                                    on
                                        t7.DIMENSIONHIERARCHY = t15.DIMENSIONHIERARCHY
                    FOR XML PATH('')), 1, 1, '')";

    }
Thanks a lot for all participants on the forum thread, and especially to Kair84 who helped me with SQL command.
Labels:
BI,
computed column,
concatenation,
D365,
Financial dimension,
group,
SQL,
view
Thursday, August 15, 2019
How to debug Workflow in D365 without access to Batch.exe
Correct me if I am wrong, but there is no specific article https://docs.microsoft.com about debugging custom Workflow in D365.
So, once I bumped into necessity to test my custom Workflow classes, I found myself unlucky not having admin rights fot Batch.exe (as described here https://ax.docentric.com/debug-workflows-in-dynamics-365-for-finance-and-operations/)
Next search results (in particular this one https://thwidmer.wordpress.com/category/dynamics-ax-2012/page/2/) brought me to the following steps.
I stopped DynamicsAxBatch, which execute actual batch processing in D365.
I added the following simple class and and a menu item button to a form.
Now I run it by the button to execute batch processing in step-by-step mode, and it perfectly hits my breakpoints inside of Workflow handlers once I attached to the standard IIS process.
So, once I bumped into necessity to test my custom Workflow classes, I found myself unlucky not having admin rights fot Batch.exe (as described here https://ax.docentric.com/debug-workflows-in-dynamics-365-for-finance-and-operations/)
Next search results (in particular this one https://thwidmer.wordpress.com/category/dynamics-ax-2012/page/2/) brought me to the following steps.
I stopped DynamicsAxBatch, which execute actual batch processing in D365.
I added the following simple class and and a menu item button to a form.
class CDPWFDebuggerActive
{
    static public void main(Args _args)
    {
        SysWorkflowMessageQueueManager::runStatic(conNull());
    }

}
Now I run it by the button to execute batch processing in step-by-step mode, and it perfectly hits my breakpoints inside of Workflow handlers once I attached to the standard IIS process.
Wednesday, August 14, 2019
How to get running totals in view
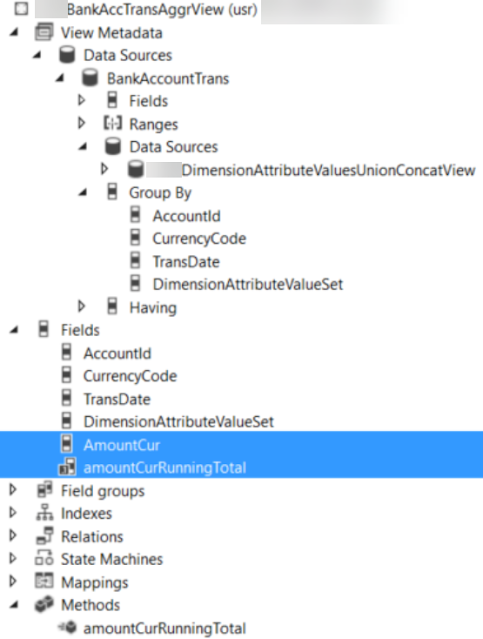
Let's say we need to see bank account balances per day with running totals.
The simplest way to achieve it is to create a view for BankAccountTrans table and add any groupings you need.
In my example, these are Bank account, transaction currency, financial dimension set, and, of course, transaction date.
I use standard aggregation Sum for my daily total and a computed column for running total.
The computed column method reads as follows
It is ready for consumption; enjoy your BI inside of D365!
A running totals query is a query in which the total for each record is a summation of that record and any previous records. This type of query is useful for displaying cumulative totals over a group of records (or over a period of time) in a graph or report.
The simplest way to achieve it is to create a view for BankAccountTrans table and add any groupings you need.
In my example, these are Bank account, transaction currency, financial dimension set, and, of course, transaction date.
I use standard aggregation Sum for my daily total and a computed column for running total.
The computed column method reads as follows
public class myBankAccTransAggrView extends common
{
    private static server str amountCurRunningTotal()   // X++
    {
        return "sum(sum(t1.AMOUNTCUR)) OVER (PARTITION by t1.DATAAREAID, t1.ACCOUNTID, t1.CURRENCYCODE  order by t1.TransDate)";
    }

}
It is ready for consumption; enjoy your BI inside of D365!
Friday, August 9, 2019
How to filter existing transactions based on a financial dimension value set
Let's assume that we want to see our bank accounts balances grouped by a financial set, which may be different than that set up for your transactions.
For example, existing transactions presume to have values for the following dimension attributes.

However, our selection can be different. For this exercise sake I opted for Business unit and Department.
So, instead of one balance for the whole bank account, we want to get it distributed per every combination of Business unit and Department values.
Another point to consider is the fact that these attributes are not mandatory; in other words, we don't have values for all attributes in all transactions.
It can be easily achieved if we find a way to create a column with all sought dimension attribute values concatenated as depicted.
Generally speaking this is a job a BI solution; however, it is possible to do in D365 by means of Views.
Let's solve this problem step by step.
Fisrt view is for all selected attributes that we should populate values for, exist them or not.
Second, collect all existing values which match our selected attributes.
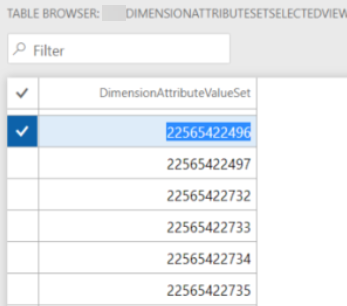
Then, group all found dimension attribute sets.
Now we create a view based on the latter and sought attributes without relation in outer join. By that we will get a Cartesian product of all possible combinations between them.
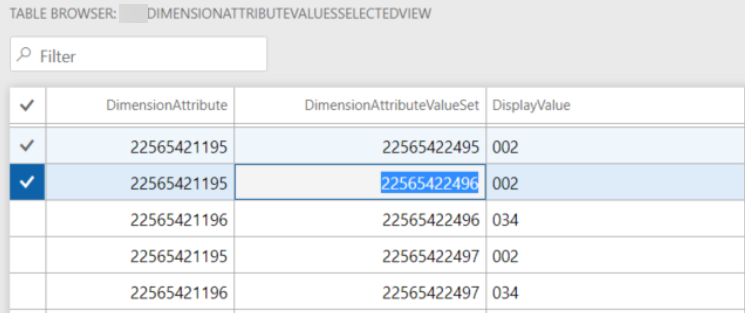
At this step we outer join the latter with the found (existing) values. Here we can add a computed column if we want to see something else than just an empty value.
Final view will contain all the values found on the previous step grouped by dimension attribute value set so that in a computed column all values be concatenated in the required order.
Having this view in inner join combination allows you to filter any transactional data by a set of dimensions without coding.
For example, existing transactions presume to have values for the following dimension attributes.

However, our selection can be different. For this exercise sake I opted for Business unit and Department.
So, instead of one balance for the whole bank account, we want to get it distributed per every combination of Business unit and Department values.
Another point to consider is the fact that these attributes are not mandatory; in other words, we don't have values for all attributes in all transactions.
It can be easily achieved if we find a way to create a column with all sought dimension attribute values concatenated as depicted.
Generally speaking this is a job a BI solution; however, it is possible to do in D365 by means of Views.
Let's solve this problem step by step.
Fisrt view is for all selected attributes that we should populate values for, exist them or not.
Second, collect all existing values which match our selected attributes.
Then, group all found dimension attribute sets.
Now we create a view based on the latter and sought attributes without relation in outer join. By that we will get a Cartesian product of all possible combinations between them.
At this step we outer join the latter with the found (existing) values. Here we can add a computed column if we want to see something else than just an empty value.
private static server str displayValueWithNA()   // X++
{
    str         sRet;
    tableName   viewName                = viewstr(myDimensionAttributeValuesUnionView);
    str         cDisplayValue  = SysComputedColumn::comparisonField(viewName,
                                                                                viewstr(myDimensionAttributeValuesSelectedView),
                                                                                fieldStr(myDimensionAttributeValuesSelectedView, DisplayValue));

    sRet =
        SysComputedColumn::if(SysComputedColumn::isNotNullExpression(cDisplayValue),
                                cDisplayValue,
                                SysComputedColumn::returnLiteral('n/a')
                            );

    return sRet;
}
Final view will contain all the values found on the previous step grouped by dimension attribute value set so that in a computed column all values be concatenated in the required order.
private static server str finDimValues()   // X++
{
    return @"STUFF((SELECT '-' + t3.DisplayValue
                from myDimensionAttributeValuesUnionView as t3
                where
                t1.DimensionAttributeValueSet = t3.DimensionAttributeValueSet
                order by t3.DIMENSIONATTRIBUTE
                for xml path('')), 1, 1, '')";
}
Having this view in inner join combination allows you to filter any transactional data by a set of dimensions without coding.
Labels:
BI,
computed column,
concatenation,
D365,
Financial dimension,
group,
SQL,
view
Subscribe to:
Comments (Atom)


_1074.jpg)


