Wednesday, October 7, 2015

DIXF setup notes


File name
That was a bad idea to name an entity with characters forbidden by Windows for filenames...


It raises an error while trying to Generate source file.


 Excel version

To work well with Excel we need to have ODBC Excel 64 bit driver installed on the server


cmd (as administrator)

AccessDatabaseEngine_x64 /passive

Excel sheet name

And not to forget to add $ at the end of lookup sheet name.


Yes, $$$ rule as usual…

Saturday, October 3, 2015

How to run a report for multiple records from a grid

Let's say we want to run our report from the previous post not from a Reports menu but directly from the Sales order form. We will use MultiSelectionHelper and its magic method createQueryRanges for this goal.

First of all we need to allow multiple selection for the menu item and place it as a button on the form.


Also we need to slightly change the report controller, so that it could receive the selected records and add an appropriate range to the query before execution.


public static void main(Args _args)
{
    ItemSalesPriceAndBarcodeController   controller = new ItemSalesPriceAndBarcodeController();

    controller.parmReportName(ssrsReportStr(SalesPriceAndBarcodeReport, Report));
    controller.parmArgs(_args);
    controller.parmShowDialog(true);
    // if it comes from the form, do not load the saved value
    if (_args && _args.dataset() == (tablenum(SalesTable)))
    {
        controller.parmLoadFromSysLastValue(false);
    }
    controller.startOperation();
}

/// <summary>
///    Executes before the report prompts and calls the method to set the ranges to the query.
/// </summary>
public void prePromptModifyContract()
{
    this.setRanges(this.getFirstQuery());
}

/// <summary>
/// Sets the report query ranges based on the caller.
/// </summary>
/// <param name="_query">
/// The hold the <c>Query</c> object of the report.
/// </param>
public void setRanges(Query _query)
{
    QueryBuildDataSource        qbds;
    QueryBuildRange             qbr;
    SalesTable                  salesTable;
    FormDataSource              salesTable_ds;
    FormRun                     caller;
    MultiSelectionHelper        helper;


    if (this.parmArgs() && this.parmArgs().dataset() == (tablenum(salesTable)))
    {
        salesTable = this.parmArgs().record();
        salesTable_ds = salesTable.dataSource();

        caller  =  this.parmArgs().caller();
        //This method will help to get only the marked records from the Grid
        helper  = MultiSelectionHelper::createFromCaller(caller);

        qbds    = _query.dataSourceTable(tablenum(salesTable));

        //Create the Query to filter using itemId
        helper.createQueryRanges(qbds, fieldStr(salesTable, SalesId));
    }
    else
    {
        qbds    = _query.dataSourceTable(tablenum(salesTable));
        qbr = qbds.addRange(fieldNum(salesTable, SalesId));
    }
}

If user selected certain orders to print from the form, we do not need to restore previously saved parameters.

Feel free to download the full project here.

How to create SSRS report with multiple independent groupings

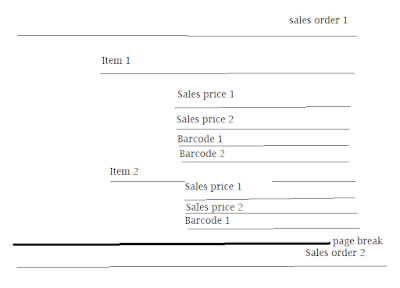
Let's say we need to print for selected sales orders all their items with sales prices and barcodes. It means our report must look like this.


One page by SalesId, some kind of a card with all items presented in the related SalesLine table. Then for each ItemId we group all its sales prices, first, and all its barcodes, second.

As suggested by Best Practice, we can create one flat temporary table (regular in my case just to ease debugging) to merge all data into one data source for our report.


Additional GroupType field is populated with different values for each table: SalesLine, Barcode, or SalesLine (could be done as enum). They will be used in report design for filtering tablix elements.

As to design we would need the main TablixSalesId with grouping by SalesId and breaking page for each instance.


Then nested TablixItemId grouped by ItemId.


Now we need to add two new ones - TablixBarcode and TablixSalesPrice without any additional grouping but with filters as follows.


This approach with adding "artificial" field to a flat table let to distinguish data and easily group and filter them.


Feel free to download the full project here.

This is the code of two principal methods of  Report data provider class.

Friday, October 2, 2015

How to lookup and set a new value for Financial dimension

Let's say we need to change a value for one of item financial dimension.

I created a simple form with the item list and their default financial dimensions that are controlled by a standard controller.


There are also two unbound controls that allows to select any related financial dimension attribute and its available value. It is done by means of two edit methods and one lookup method, which can be added to your class and used everywhere you need.


A new chosen value can be set for the item financial dimension by the Set new value button. Actually it uses a method that, again, can be added to your class a static one.

I would like to thank Carsten Glem for his comment on this topic.

Here comes the code for the main methods. Feel free also to download the whole project.