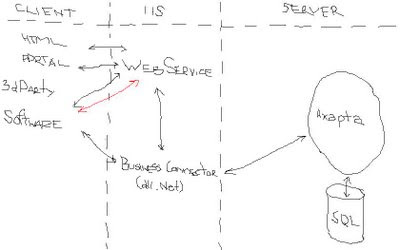
Then, we must to enable the same on the Business Connector with Configuration Utility: (in my case I had to check both in order to debug my web service)

Now, you can add a breakpoint in your code.

Finally, you should run an instance of Debugger manually from the client's main menu because it does not start automatically as usually.

In conclusion I need to say that you should log in on your debugged application with the same user account which was used for the client and debugger sessions.

Lucky hunt for bugs!


_1074.jpg)


